Data-driven RNA Folding Landscapes
Back in December of 2020 I presented my paper on recreating folding landscapes of RNA using a combination of graph signal processing and deep learning. Here I would like to go through the idea behind that paper and explain our approach to the problem we sought out to address.
RNA: the stars of our generation
While proteins get most of the attention when it comes to studying who the major players are in a biological process, RNA has been getting it’s time in the spotlight recently. Just in the last few years, RNA has underscored it’s importance through its role in the CRISPR machinery which allows for the editing of genomes as well as it’s utility as a means for quickly developing vaccines.
A type of RNA that you’re likely familiar with is messenger RNA (mRNA) because of its role in the transfer of information between DNA and the end product protein. The famed “central dogma of biology” in other words. But as pervasive as that perspective of RNA is, it only scratches the surface of what RNA can do. This is no better exemplified by the fact that such a small amount of the genome codes for proteins (~1%). A lot of these non-coding RNA (ncRNAs) carry out functions themselves like detecting signals (riboswitches) or targeting things in a cell that should be broken down (siRNA).
Importantly, functional RNA are similar to proteins in that they must fold onto itself into a certain shape to carry out their role. A key driver in how an RNA folds is it’s nucleotide sequence and so it’s sometimes possible to predict how an RNA may fold using that sequence information by applying the core idea of the thermodynamic hypothesis.
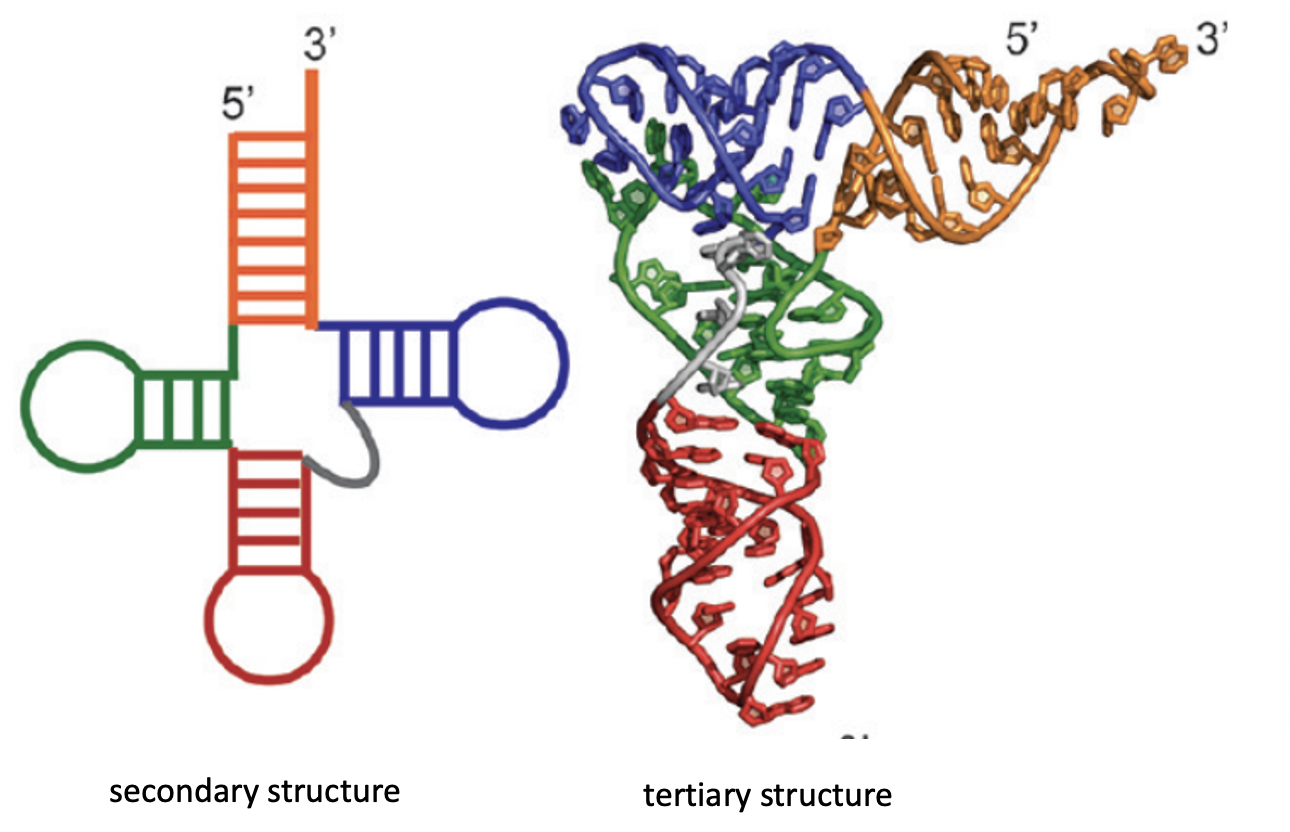
Before we go further, we should clear up our definition of a fold in this context. Because RNA are relatively small compared to their protein counterparts, we can simplify our description of it’s fold from the 3D case to the 2D case without losing too much information. This 2D description of an RNA’s fold is called it’s secondary structure and is comprised of the backbone of the RNA chain and bonds between non-sequential positions. For the remainder of this blog post, I’ll use secondary structure and fold interchangably.
Biomolecules are Dynamic
Finding the most stable RNA secondary structure, which we will refer to as the minimum free energy (MFE) structure, can be viewed as a mathematical pairing problem. There are several tools, such as Vienna RNAfold, which are able to solve an underlying problem using thermodynamic approximations of the stabilizing contributions of each bond type (G to C vs U to A). Using the output MFE structure, we can start of make inferences about the RNA’s behavior.
But wait! Biomolecules are not static objects. RNA are no exception.
Biomolecules are not static and are in fact under constant flux due to a crowded intracellular environment. Indeed, if you simulate the movements of a small protein in just an aqueous bath you can see major conformational changes over the span of nanoseconds. Furthermore, many ncRNAs, such as riboswitches, are known to be move between multiple conformations and thus a single structure would not be representative of that RNA sequence.
\ Even if we ignore this argument, there are also the thermodynamic approximations to address. Software like Vienna RNAfold simplify the folding problem by using approximated energy parameters to determine the stability conferred by each bond a potential structure. This can be problematic in that the MFE solution is quite sensitive to these value of these parameters and the implicit focus on helices (stretches of consecutive bonds) in a structure leaves room for many potential solutions.
Because of these reasons, we argue that a focus on MFE structure introduces a strong bias to downstream analysis and can result in an inaccurate, or at least very incomplete, view of the RNA of interest. For this reason, a more hollistic view of the folds a given RNA sequence can take is required.
So what else can we do?
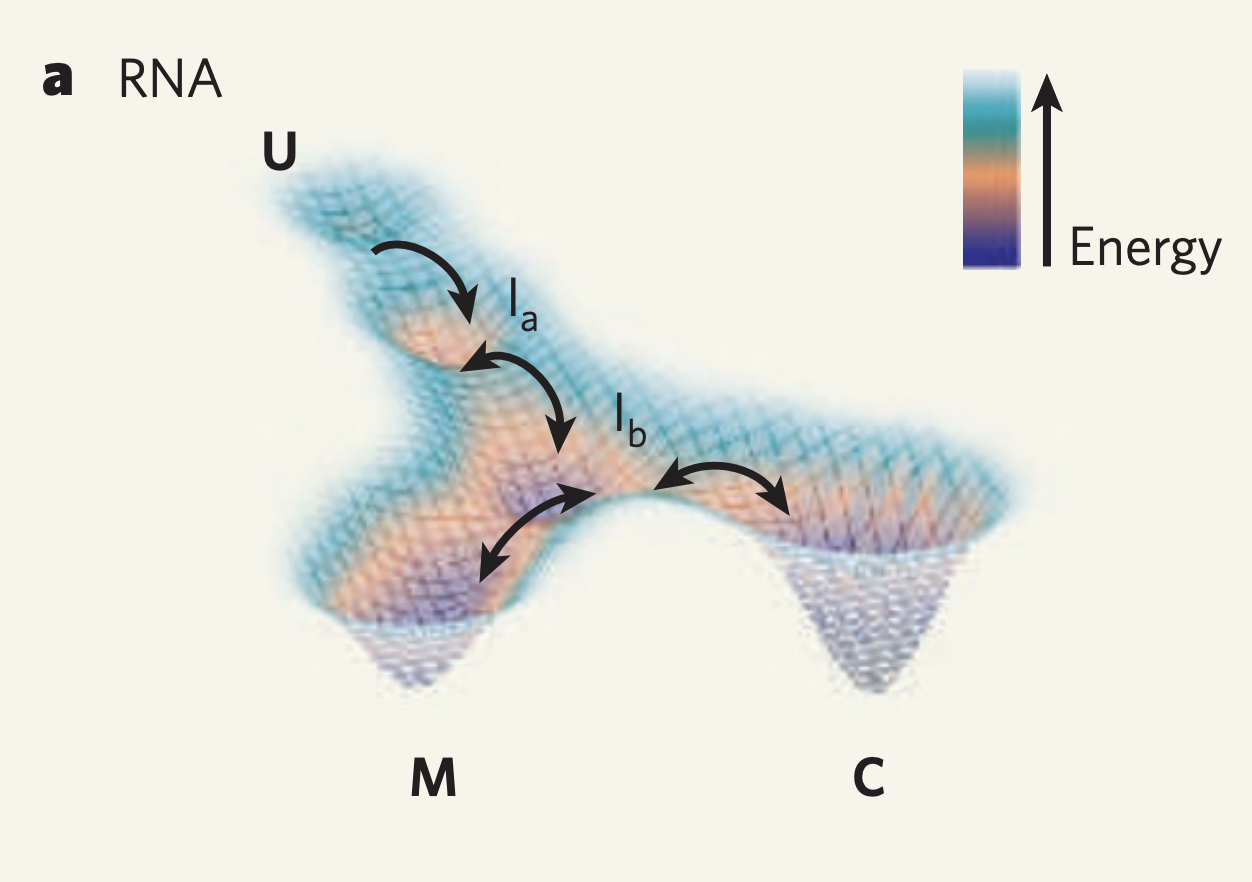
Well we can get a broader view of an RNA’s structure by looking at it’s folding landscape. A folding landscape is made up of a collection of folds and their corresponding stabilities and is often visualized using a 3D surface. In this visualization, x and y axes capture similarities in structure and the y axis shows stability. From a folding landscape, we can identify energy minima and possible folding trajectories. From the former we can see if more than one fold is likely to be found in the cell. In the case of RNA, a folding landscape is likely to be smooth with respect to changes in stability due to the stepwise nature of RNA folding. In other words, the folding landscape should appear more like gradual hills than like cliffs or sharp peaks.
But how do we generate a folding landscape? Well we need two things
- A distance metric between folds that compares meaningful structural information of two structures.
- A way to enforce that smoothness with respect to stability in the coordinates of each structure.
To acheive this we combine strengths from graph scattering transforms and autoencoders.
Comparing Graph Representations
We begin by viewing the set of RNA folds for a given sequence as un-weighted graphs. Thanks to the underlying biochemical constraints of RNA structures, these graphs are relatively simple in that each node has a degree of either 2 or 3.

Now there are a few ways we can compare two graphs and retrieve some quantitative value for how similar or different they are. In our paper we compare against some of the more traditional approaches. One straightforward way is by taking the L1 distance between the adjacency matrices, which is available to us as since the underlying RNA sequence provides a node ordering. Another well-known method is via the WL-kernel.
More recently, graph neural networks have provided a method for learning a graph representation through neighborhood aggregation layers and a pooling method. In our paper we compare against a graph encoder that uses a series of graph convolutional layers and then passes the resulting node represenations through a pooling operation to arrive at a graph-wise representation.
In our method we use alternative approach to producing a graph representation. We pull from the graph signal processing literature and use a variant of the graph scattering transform to produce a graph represention. I plan to do another post on how the graph scattering transform works but for now it’s nice to view them as an graph signal processing analog to graph neural networks. Instead of using a graph convolutional layer, parameterized by a trained filter matrix, the graph scattering transform begins with a designed filter bank which similarly applies some localized operation on the graph. The final set of node representations then go through a pooling operation to produce a graph-wise representation.
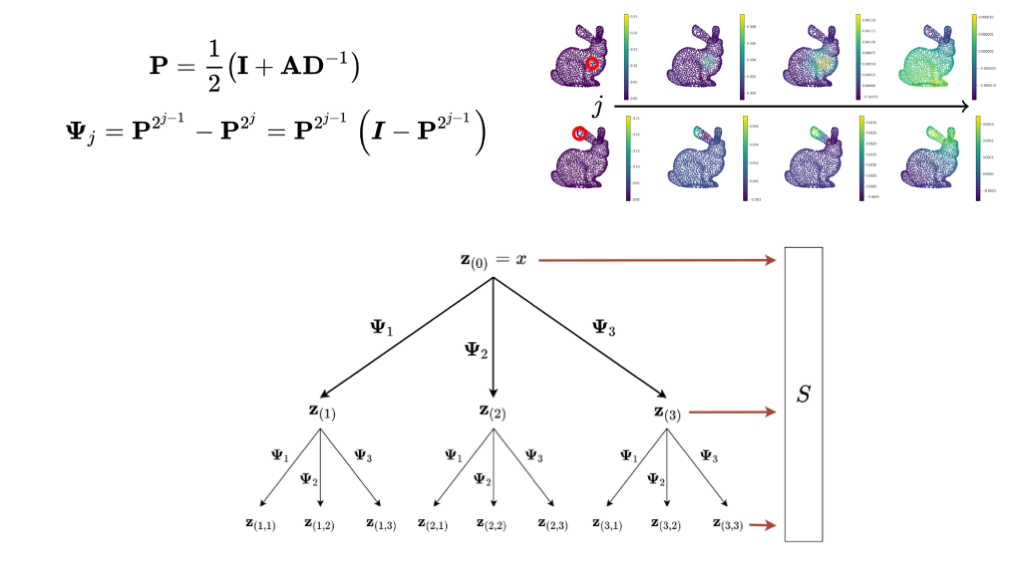
We tested these approaches and found that graph scattering transforms, as a likely consequence of the way it’s filter bank is designed, is best able to capture the structural information we are interested in. The multi-scale nature of diffusion wavelets, as parameterized by number of steps, is able encode the hierarchical nature of RNA secondary structure.
Using the scattering coeffients of each graph for comparisons, we can now begin to generate potential x and y coordinates for the folding landscape. Since we have now converted the discrete graphs to a continous vector representation, we can use the euclidean distance between the scattering coefficents of two RNA structure graphs as a distance for the folding landscape.
But as we show in the paper, these graph representations lack the level of smoothness with respect to stability we are aiming for. To get there, we leverage the representational power of deep learning.
Enforcing Smoothness
In addition, graph scattering transforms produce a high-dimensional set of coefficients, some of which may be redundant or non-informative. In order to both reduce this representation to something with much lower dimensionality and gain the smoothness property, we leverage a autoencoder architecture inspired by this paper.
We take our RNA graphs, now represented as scattering coefficients, as pass them through an autoencoder trained with both a reconstruction task as well as a stability prediction task. We also include a bottleneck to lower the dimensionality of our representations. We observe that training an autoencoder to predict some property from it’s latent space representation induces a smoothness with respect to that property while still retaining the ability to interpolate between datapoints.
We describe smoothness both quantitively and qualitatively in our paper. For a quantitative measure of how smooth a latent space is, we use the graph laplacian operator formed using the KNN graph from the latent representations of our datapoints. The quadratic form of this operator and some signal, the signal here being stability, effectively calculates the squared difference of stabilities between a point and it’s K nearest neighbors.
We find that scattering coefficients, passed through a bottlneck autoencoder, provide the best results when forming a latent space that is smooth with respect to graph structure and stability. This is likely due to the ability of graph scattering transforms to extract multi-scale information from the RNA graphs while the commonly-used GCN layer suffers from a over-smoothing problem with increasing depth.
From Data to Folding Landscape
The end result of our approach is a model which, once trained on a set of RNA graphs and their stabilities, can encode each graph into a low dimensional representation that possesses information about its structure and stability in its coordinates. One of the strengths of this approach is that we can also interpolate as well as conduct nearest neighbor searches for potential folding intermediates. This is useful when exploring the enormous tructural space of an RNA sequence as the number of structures grows exponentially with sequence (N1.8)